Posts Tagged ‘Productivity’

Using Social Psychology to Motivate Contribution to Online Communities

March 16, 2014

Ling et al

Using Social Psychology to Motivate Contribution to Online Communities

Field testing four design principals derived from Social Loafing. Aim, stronger link between social science theory and CSCW. Identified the abstract mental state the theories propose should lead to contribution, then translated into specific mental state participants likely to have, then designed persuasive message or other stimuli to promote these mental states.

Test 1 Paired like and unlike groups, because uniqueness can stimulate participation (as the antitheses of the reliance of social loafing) and uniques contributed more (confounded by messages to participants which acted as prodding to participate).

Test 2 reached out to members who has reviewed rarely reviewed movies, promoted with message focusing on their uniqueness with variable in benefit, no benefit, only benefit to self, only benefit to others and benefit to self and others. Only uniqueness of individual contributed to increased effort.

Test 3 determining if the act of receiving the message increased the salience (mental prominence) of intrinsic motivation. It was concerning that in test 2, mentioning self or other benefit decreased participation but mentioning both did not. Presented identical verbiage but added “they tell us they rate because it is fun” caused an increase but not a statistically significant.

Test 4, motivating through goal setting. Hypotheses tested member who have a goal will rate more and members with an individual assigned goal will rate more still. Specific goals work more than general (just do your best), group goals more than individuals. difficulty of goal has a convex effect on contributions (weakly supported). Researchers felt where social science theories didn’t match up, it was the case of poor implementation and incomplete theories.

The one think you should know: Movie rating website, researchers attempted to link social science theory with CSCW. Good for study design.

HomeNet: A Field Trial of Residential Internet Services

March 16, 2014

Kraut et al

HomeNet: A Field Trial of Residential Internet Services

Nice empirical study, 48 families (157 participants) got the internet in 1995, 25% poor, 25% minority, over half female, over half children. After five months half were regular users, teenagers had the deepest saturation, teens modeled as early adopters. Half checked out porn, but 20% looked at it more than three times. Three created content.


The one thing you need to know: At home internet is a good idea, teenagers use it more.

Human Centered Systems in the Perspective of Organizational and Social Informatics

October 25, 2013

Human Centered Systems in the Perspective of Organizational and Social Informatics

Rob Kling (acm)
Leigh Star (acm)

Computers and Society, March 1998

If you’re only going to remember one(?) thing:

The question of what is and isn’t HCS may be divided into four parts:

    1. What do we mean by human?
    2. What is a system?
    3. What are the goals of a human-centered system or process?
    4. What are the processes associated with HCS?’

Human-centered systems are designed to complement human skills. The impetus to build such systems are based on human needs, for information, assistance, or knowledge.

Overview:

The term “human centered automation,” which is one of the intellectual roots of the term “Human Centered Systems,” has been advanced within the field of human factors to refer to system that are

    1. based on an analysis of the human tasks that the system is aiding
    2. monitored for performance in terms of human benefits
    3. built to take account of human skills and
    4. adaptable easily to changing human needs.

The analysis of any aspect of systems should take into account at least four dimensions of human-centeredness:

    1. A human centered analysis must take account of varied social units that structure work and information–organizations and teams, communities and their distinctive social processes and practices.
    2. It would take into account how criteria of evaluation are generated and applied, and for whose benefit. It would include the participation of stakeholder groups
    3. As with the architecture of buildings, the architecture of machines embody questions of livability, usability and sustainability.
    4. the question of whose problems are being solved is important–systems which seek only to answer a very narrow technical or economic agenda or a set of theoretical technical points do not belong under the “human centered” rubric.

“One size fits all” seems distinctively non human-centered. On the other hand, we don’t believe that complete tailorability results in human centered systems, because few people have the time or interest to effectively learn how to tailor thousands of features in complex computer systems.

We did not believe that certain kinds of applications, such as medical diagnostic aids, should be automatically be called human-centered because improved medical diagnosis can help people. For example, a medical diagnostic system whose logic is difficult for a doctor to comprehend or interrogate would not be very human-centered.

People adapt and learn, and from the point of view of systems design, development and use, it is important to take account of the adaptational capabilities of humans (Dervin, 1992). Something that freezes at one development stage, or one stereotyped user behavior, will not fit a human centered definition.

What are the processes associated with design, use and analysis of HCS?

understand the importance of multiple media (paper, computing, video, conversation, etc.) in the process of design. That is, information systems are always part of a large ecology of communicative devices and conventions

the usability of a system depends on infrastructural configurations of all sorts. Computers sent to a developing country without knowledge of the problems with its power grid and the dust-filled atmosphere may fail for reasons other than pure design

Technology does not and will not solve social justice problems. For example, putting more computers into inner city classrooms will not per se increase literacy.

articulating the values that are at stake in design processes themselves. This means examining the values of both designers and of the intended systems audiences and also being able to identify value-conflicts.

machinery should not be anthropomorphised. Machines should extend human capability as gracefully as possible.

SAP (information processing system) is not a “human centered system;” it is a strong example of an “organization centered system” that makes exceptional demands upon people to use it effectively. SAP is an interesting contrast to the kinds of Human Centered Systems (and design principles) that a research program should promote.

Neither technical excellence nor market share alone define system survival. ”Network externalities, ” on the other hand, can play a substantial role in the sustainability of system. (Network externalities are the effects on a user of a product or service of others using the same or compatible products or services. Positive network externalities exist if the benefits are an increasing function of the number of other users. Negative network externalities exist if the benefits are a decreasing function of the number of other users.)

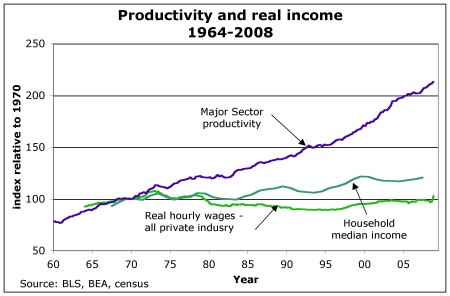
The discrepancy between the expected economic benefits of computerization and measured effects has been termed “The Productivity Paradox,” based on a comment attributed to Nobel laureate Robert Solow who remarked that  “computers are showing up everywhere except in the [productivity] statistics.” (Not sure this is true. See chart below)

WageProductivityChart

It is common for systems designers to conceptualize computerized systems in terms of organizations and individuals (“users”). But there are important intermediate levels of social organization between individuals and the larger collectivity.

Brown and Duguid (1991) coined the term “communities of practice” (CoPs) to refer to people who are concerned with a common set of work practices. They are not a team, a task force, and not even necessarily an authorized or identified group. What holds them together is a common sense of purpose and a real need to know what each other knows.

Local communities, as well, can be important units of analysis and frames of reference for human centered computing. “Community information systems” may mean organized information provision to special constituencies (e.g. cancer patients, small business owners, hobbyists), or it may be geographically local provision of services, including freenets and other public computing facilities.

email was the “killer application” that drove up the use and demand for the Internet (e.g. in contrast with file transfer)

There is an understanding of emergent social psychological processes when individuals work together in groups with computer networks

The Google Similarity Distance (not in list, but a must read)

October 22, 2013

The Google Similarity Distance

Rudi L. Cilibrasi (acm)

Paul M.B. Vitanyi (acm) (google citations)

IEEE TRANSACTIONS ON KNOWLEDGE AND DATA ENGINEERING, VOL. 19, NO 3, MARCH 2007, 370–383

If you’re going to remember one(?) thing: 

Semantic cognition using algorithms appears to be possible.

Running code is available for download at http://www.complearn.org

Overview:

A way of using search engine results to compute a semantic relationship between any two (n?) items. It basically uses Information Distance / Kolmogorov Complexity to determine similarity. From the paper:

While the theory we propose is rather intricate, the resulting method is simple enough. We give an example: At the time of doing the experiment, a Google search for “horse”, returned 46,700,000 hits. The number of hits for the search term “rider” was 12,200,000. Searching for the pages where both “horse” and “rider” occur gave 2,630,000 hits, and Google indexed 8,058,044,651 web pages. Using these numbers in the main formula (III.3) we derive below, with N = 8, 058, 044, 651, this yields a Normalized Google Distance between the terms “horse” and “rider” as follows:

NGD(horse, rider) ≈ 0.443.

In the sequel of the paper we argue that the NGD is a normed semantic distance between the terms in question, usually (but not always, see below) in between 0 (identical) and 1 (unrelated), in the cognitive space invoked by the usage of the terms on the world-wide-web as filtered by Google.

This really sounds like a usable model of cognition. For example:

For us, the Google semantics of a word or phrase consists of the set of web pages returned by the query concerned. Note that this can mean that terms with different meaning have the same semantics, and that opposites like ”true” and ”false” often have a similar semantics. Thus, we just discover associations between terms, suggesting a likely relationship.

A brief history of human-computer interaction technology

October 19, 2013

A brief history of human-computer interaction technology

Brad A. Myers (acm) (google)

(1998) Interactions 5,2, 44–54.

If you’re going to remember one(?) thing: 

The concept of direct manipulation interfaces for everyone was envisioned by Alan Kay of Xerox PARC in a 1977 article about the Dynabook [18]. The first commercial systems to use direct manipulation extensively were the Xerox Star (1981) [45], the Apple Lisa (1982) [54], and the Macintosh (1984) [55]. Ben Shneiderman at the University of Maryland coined the term “direct manipulation” in 1982, identified the components, and gave psychological motivations for direct manipulation [43].

Alan Kay proposed the idea of overlapping windows in his 1969 doctoral thesis [17], and overlapping windows first appeared in 1974 in his Smalltalk system [12] at Xerox PARC, and soon afterward in the InterLisp system [50].

Overview:

The ubiquitous graphical interface used by Microsoft Windows 95, which is based on the Macintosh, which is based on work at Xerox PARC, which in turn is based on early research at the Stanford Research Laboratory (now SRI) and at Massachusetts Institute of Technology.

The remarkable growth of the World Wide Web is a direct result of HCI research: applying hypertext technology to browsers allows one to traverse a link across the world with a click of the mouse. More than anything else, improvements to interfaces have triggered this explosive growth.

The technologies discussed in this paper include fundamental interaction styles such as direct manipulation, the mouse pointing device, and windows; several important kinds of application areas, such as drawing, text editing, and spreadsheets; the technologies that will likely have the biggest impact on interfaces of the future, such as gesture recognitionmultimedia, three-dimensionality, CSCW, and Natural Language Processing; and the technologies used to create interfaces using the other technologies, such as user interface management systems, toolkits, and interface builders.

William Newman’s Reaction Handler [33], created at Imperial College, London during 1966 and 1967, provided direct manipulation of graphics and introduced Light Handles [32], a form of graphical potentiometer that was probably the first “widget.”

David Canfield Smith coined the term “icons” in his 1975 doctoral thesis on Pygmalion. Smith later popularized icons as one of the chief designers of the Xerox Star [45].

The mouse was developed at Stanford Research Laboratory in 1965 as part of the NLS project. It was intended to be a cheap replacement for light pens, which had been used at least since 1954 [11, p. 68]. Many of the current uses of the mouse were demonstrated by Doug Engelbart as part of NLS in a movie created in 1968

The X Window System, a current international standard, was developed at MIT in 1984

The idea for hypertext (by which documents are linked to related documents) is credited to Vannevar Bush’s famous MEMEX idea from 1945 [4]. Ted Nelson coined the term “hypertext” in 1965 [31]. Engelbart’s NLS system [9] at the Stanford Research Laboratories in 1965 made extensive use of linking. Ben Shneiderman’s Hyperties was the first system in which highlighted items in the text could be clicked on to go to other pages

Electronic mail, still the most widespread multiuser software, was enabled by the ARPAnet, which became operational in 1969, and by the Ethernet from Xerox PARC in 1973.

The Apple Macintosh (1984) was the first to actively promote its toolkit for use by other developers to enforce a consistent interface


Natural language Dialogue for Personalized Interaction

September 27, 2013

Natural language Dialogue for Personalized Interaction

Wlodek Zadrozny

Malgorzata Budzikowska

Joyce Chai

Nanda Kambhatla

Sylvie Levesque

Nicolas Nicolov

(2000) , Communications of the ACM, ACM Press, 43(8), 116-120

If you’re going to remember one(?) thing: 

“Our repositories of knowledge are not designed for Natural Language interaction.”

Overview: 

The article lays out the case that individualized interaction is the key to personalization. It then goes on to describe how middleware could achieve this, possible through the use of DMML: “DMML—inspired by the theory of speech acts and XML—is an attempt to capture the intent of  communicative agents in the context of NL dialogue management. The idea is to codify dialogue moves such as greetings, warnings, reminders, thanks, notifications, clarifications, or confirmations in a set of tags connected at runtime with NL understanding modules, which allows us to describe participants’ behaviors in terms of dialogue moves, without worrying about how they are expressed in language.”

Although this was tried, it – like ontologies  – never worked outside of highly specialized situations. More recently, the concept of individualization seems more driven by Big Data, possible in the way that Google Translate maps one language to another as described in this Technology Review article. Or, the paper it was from: http://arxiv.org/pdf/1309.4168v1.pdf

Excerpts

The business goal of such computerized systems is to create the marketplace of one. In essence, improved discourse models can enable better one-to-one context for each individual.

Major NL limitations include: Lack of precise user models (for example, knowing how demographics and personal characteristics of a person should be reflected in the type of language and dialogue the system is using with the user),and our repositories of knowledge are not designed for NL interaction.

Why does dialogue work? It enhances the robustness of communication: a partial match is enough to make progress and leads to successful interaction through negotiation. It also increases the efficiency of communication: lacking pieces of knowledge are deduced from encoded knowledge (back-end) or personalized data (front-end).

The choice of domain depends on business factors, technology factors and the relationships between the two. A few of the many relevant factors include the channel(s) of interaction (phone vs. Web), the importance of the number of concepts and relations in the domain of discourse, the availability of dictionaries, and the capability to recognize users requests and connect them with an appropriate execution mechanism (for example, what should count as a “matching shirt” or “inexpensive laptop” is a combination of user expectations and business decisions.

As we mentioned in our opening remarks, the impediments to progress lie on several planes. They include language issues, in particular, semantics.

Another issue where more progress would help is the lack of precise user models. Let us assume we can have any piece of information about a person. How could we use this knowledge to make this person’s interaction with a dialogue system most effective and pleasant?

DMML—inspired by the theory of speech acts and XML—is an attempt to capture the intent of communicative agents in the context of NL dialogue management.
The idea is to codify dialogue moves1 such as greetings, warnings, reminders, thanks, notifications, clarifications, or confirmations in a set of tags connected at runtime with NL understanding modules, which allows us to describe participants’ behaviors in terms of dialogue moves, without worrying about how they are expressed in language.

This is not sufficient since neither provides the level of granularity we often desire, that is, access to specific information in a limited context. Furthermore, both are passive. Thus, it is a logical next step to make the knowledge active and adaptable to the user. The problem is not simple because it involves both rethinking the format in which data is stored, and creating dialogue interfaces that incorporate some knowledge of the domain.

Iterative User Interface Design

September 9, 2013

Iterative user interface design

Jacob Nielsen

(1993)  Computer, 26(11), 32-41.

If you’re going to remember one(?) thing:

Usability has many aspects, and is often associated with the following 5 attributes :

    • Easy to learn: The user can quickly go from not knowing the system to getting some work done with it.
    • Efficient to use: Once the user has learned the system, a high level of productivity is possible.
    • Easy to remember: The infrequent user is able to return to using the system after some period of not having used it, without having to learn everything all over.
    • Few errors: Users do not make many errors during the use of the system, or if they do make errors they can easily recover from them. Also, no catastrophic errors should occur.
    • Pleasant to use: Users are subjectively satisfied by using the system; they like it.

Overview: 

Redesigning user interfaces on the basis of user testing can substantially improve usability. In four case studies, the median improvement in overall usability was 165% from the first to the last iteration, and the median improvement per iteration was 38%. Iterating through at least three versions of the interface is recommended, since some usability metrics may decrease in some versions if a redesign has focused on improving other parameters.

Excerpts

It has long been recognized that user interfaces should be designed iteratively in almost all cases because it is virtually impossible to design a user interface that has no usability problems from the start. Even the best usability experts cannot design perfect user interfaces in a single attempt, so a usability engineering lifecycle should be built around the concept of iteration.

An iterative design methodology does not involve blindly replacing interface elements with alternative new design ideas. If one has to choose between two or more interface alternatives, it is possible to perform comparative testing to measure which alternative is the most usable, but such tests are usually viewed as constituting a different methodology than iterative design as such, and they may be performed with a focus on measurement instead of the finding of usability problems. Iterative design is specifically aimed at refinement based on lessons learned from previous iterations.

A lower bound estimate of the value of the user interface improvements comes from calculating the time saved by users because of the shorter task completion times, thus leaving out any value of the other improvements.

This article focuses on usability as the question of how well users can use that functionality. Note that the concept of “utility” does not necessarily have to be restricted to work-oriented software. Educational software has high utility if students learn from using it, and an entertainment product has high utility if it is fun to use.

Easy to learn: The user can quickly go from not knowing the system to getting some work done with it.
Efficient to use: Once the user has learned the system, a high level of productivity is possible.
Easy to remember: The infrequent user is able to return to using the system after some period of not having used it, without having to learn everything all over.
Few errors: Users do not make many errors during the use of the system, or if they do make errors they can easily recover from them. Also, no catastrophic errors should occur.
Pleasant to use: Users are subjectively satisfied by using the system; they like it.

This progression from quality goals over quality attributes and their metrics to the actual measures thus makes usability steadily more concrete and operationalized.

These analytical methods are substantially weaker at estimating error rates and are unable to address the subjective “pleasant to use” dimension of usability. [Diametrically opposed to The prospects for psychological science in human-computer  interaction]

Two ways of obtaining expert users without having to train them are to involve expert users of any prior release of the product and to use the developers themselves as test users. Of course, one should keep in mind that a developer has a much more extensive understanding of the system than a user would have, so one should always test with some real users also.

Ultimately, the measure of usability should probably be monetary in order to allow comparisons with other measures such as implementation or purchase expenses.

Due to the difficulties of using monetary measures of all usability attributes, an alternative approach has been chosen here. Overall usability is calculated in relative terms as the geometric mean (the n ‘th root of the product) of the normalized values of the relative improvements in the individual usability metrics. The geometric mean increases more by improving all the usability metrics a little than by improving a single metric a lot and leaving the others stagnant.

Past, Present and Future of User Interface Software Tools

August 25, 2013

Past, Present and Future of User Interface Software Tools

Brad Myers (citations)

Scott E. Hudson (citations)

Randy Pausch (the last lecture)

Human Computer Interaction Institute
School of Computer Science
Carnegie Mellon University

If you’re going to remember one(?) thing:

The era of the desktop metaphor is over. Since there will be (or is from the 2013 perspective) such a variety of interaction (mouse, touch, voice or gesture recognition), tools will need to be able to support the creation of interfaces that support these varieties in interaction along with a huge variation in displays.

Overview:

This paper walks through the kinds of tools that software developers use to create user interfaces. Because of the standardization on the desktop metaphor since the mid 1980’s the ability for a tool to aid in the development of a GUI has been significant (the article cites Visual Basic as a particularly successful example). An effective (ideal?)  tool in this case has a low threshold for learning and a high ceiling for capability. Without this low threshold, the tool may not get adopted, even if it is very capable. This is also true for languages, where ‘hard’ languages like C are regularly challanged by simple scripting languages like JavaScript. Inevitably though the scripting languages become more complex to handle needed capability.

Groupware and social dynamics: eight challenges for developers

August 3, 2013

Groupware and social dynamics: eight challenges for developers

Jonathan Grudin

Communications of the ACM, (1994) 37(1), 92-105.


If you’re going to remember one(?) thing:

  • A single user application preferred by one in five users is a hit. Goupware used by 20% of the group members is a disaster.

Overview:

Groupware

dilbert

Readings in Information Visualziation: Using Vision to Think.

June 3, 2013

Card, St.; Mackinlay, J. D.; Shneiderman, B. (1999)

Information Visualization. In: Readings in Information Visualziation: Using Vision to Think. Chapter 1. (This is not a link to the paper, just someone’s notes. I guess I need to get the book from somewhere)

Morgan Kaufmann. pp. 1-34.


If you’re going to remember one(?) thing:

  • “The purpose of visualization is insight , not pictures.” The main goals of this insight are discovery, decision making, and explanation. Information visualization is useful to the extent that it increases our ability to perform these and other cognitive activities.
  • External Cognition – Use of the external world to accomplish cognition.
  • Information design – Design of external representations to amplify cognition.
  • Data graphics – Use of abstract, nonrepresentational visual representations of data to amplify cognition.
  • Visualization – Use of computer-based, interactive visual representations of data to amplify cognition.
    • Scientific visualization – Use of interactive visual representations of scientific data, typically physically based, to amplify cognition.
    • Information visualization – Use of interactive visual representations of abstract, nonphysically based data to amplify cognition.
  • We propose six major ways in which visualizations can amplify cognition (Table 13): (1) by increasing the memory and processing resources available to the users, (2) by reducing the search for information, (3) by using visual representations to enhance the detection of patterns, ( 4) by enabling perceptual inference operations, (5) by using perceptual attention mechanisms for monitoring, and (6) by encoding information in a manipulable medium.

Overview:

  • The ubiquity of visual metaphors in describing cognitive processes hints at a nexus of relationships between what we see and what we think.
  • An important class of the external aids that make us smart are graphical inventions of all sorts. These serve two related but quite distinct purposes. One purpose is for communicating an idea, for which it is sometimes said, “A picture is worth ten thousand words.”‘ Communicating an idea requires, of course, already having the idea to communicate. The second purpose is to use graphical means to create or discover the idea itself: using the special properties of visual perception to resolve logical problems.
  • The evolution of computers is making possible a medium for graphics with dramatically improved rendering, real-time interactivity, and dramatically lower cost. This medium allows graphic depictions that automatically assemble thousands of data objects into pictures, revealing hidden patterns. It allows diagrams that move, react, or even initiate. These, in turn, create new methods for amplifying cognition.
  • Visual and manipulative use of the external world amplifies cognitive performance, even for this supposedly mental task of multiplying numbers. And if we had chosen Lo multiply 3- or 4-digit numbers-or 25-digit numbers-then the task would have quickly become impossible to do mentally at all. By writing intermediate results in neatly aligned columns, the doer of multiplication creates a visual addressing structure that minimizes visual search and speeds access. An internal memory task is converted to an external visual search and manual writing task.
  • Nomographs are visual devices that allow specialized computations. However, it would be even better to just ask someone. What are the times that we really need/want to explore visually?
  • Although visually based devices can aid mental abilities, they are not the only means of augmentation. Direct computational devices may do as well or better.
  • Each type of map sacrifices accurate representation of some physical property of the earth, because its true purpose is to support specific calculations.
  • Tufte’s chart of the same data (Figure 1. 7) tells a different story. It uses a simple scattergraph depicting the relationship between the two major variables of interest. Different types of damage are combined into a single index of severity. The proposed launch temperature is also put on the chart to show it in relation to the data. Isn’t this a direct computational device with a graphical output? “There are right ways and wrong ways to show data; there are displays that reveal the truth and displays that do not”
  • Visual artifacts aid thought; in fact, they are completely entwined with cognitive action. The progress of civilization can be read in the invention of visual artifacts, from writing to mathematics, to maps, to printing, to diagrams, to visual computing. But it remains to puzzle out through cycles of system building and analysis how to build the next generation of such artifacts.
  • A knowledge crystallization task is one in which a person gathers information for some purpose, makes sense of it (Russell et al., 1993) by constructing a representational framework (which we will refer to as a schema), and then packages it into some form for communication or action.
  • Diagrams help in three basic ways: (1) By grouping together information that is used together, large amounts of search are avoided. (2) By using location to group information about a single element, the need to match symbolic labels is avoided, leading to reductions in search and working memory. (3) In addition, the visual representation automatically supported a large number of perceptual inferences that are extremely easy for humans.
  • Variahles come in three basic types:

    N = Nominal (are only= or”#. to other values),
    O – Ordinal (obeys a< relation), or
    Q = Quantitative (can do arithmetic on them).

    A nominal variable N is an unordered set, such as film titles. An ordinal variable  is a
    tuple (ordered set), such as film ratings. A quantitative variable Q is a numeric range, such as film length.

  • Data Tables can often be mapped into the visual representations in multiple ways. A mapping is said to be expressive if all and only the data in the Data Table are also represented in the Visual Structure. Good mappings are difficult, because it is easy for unwanted data to appear in the Visual Structure